2. Prediction of Minimum Drag
2.2 Wind-tunnel / Flight experiment
Most direct and precise method to evaluate the drag is flight experiment using actual aircraft. However, even in that case, thrust, air and manufacturing uncertainty could make variation in aircraft drag value while cost of real-flight is rocketing high. Indeed, drag measurement for complete aircraft is not recommended before design is fully matured.
Most of the drag measurement test for the jet fighter design focuses on scaled model for both wind-tunnel and flight test. In recent years, free-flight measurement of scaled model is only conducted for high AoA characteristics because there is no limitation of DoF via sting. However, at the early age of the aeronautics, before wind-tunnel experiment technique for scaled model is fully developed, there were many free-flight experiment and part of them [5-8] are introduced. Fig. 2.16 shows symmetric half-model is attached on the modified P-51 for this experiment. In order to evaluate the drag in various Reynolds number condition, several altitudes are chosen to simulate the high speed. While reference [6] concerns that that kind of experiment shows wave drag factor is higher than that of theoretical value.
US investigated minimum drag of the generic body combination of body, wing and tails as shown in Fig. 2.18 [7]. It results extended data-base for minimum drag deeply related to the transonic performance the early jets. It also showed that resulted drag from the complex body is not simple combination of each components. Effect of swept-back wing is shown via delaying drag-increase near the M1.0, huge drag barrier for transonic area. For more than transonic area, rocket vehicles are used to simulate the drag environment [8]; effect of ramjet on the whole vehicle drag is also investigated. That term called spillage drag caused by propulsion system give impact on the free-stream near the inlet, and change the minimum drag value.

Fig. 2.16. Scaled model of F7U is attached on the aircraft to measure the drag of the model [5]

Fig. 2.17. Experimental wave drag factor is larger than that of expected by linear theory [6]

Fig. 2.18. Flight investigation from high sub-sonic to supersonic to determine the minimum drag [7]

Fig. 2.19. Drag measurement via experimental rocket vehicle [8]
Hoffman, and Chaubin [9] conducted aerodynamic heat effect on the wind-shield of the supersonic jet with flight experiment. Heat loading on the canopy is important for material property and structure because stress caused by both aerodynamic pressure and thermal expansion can weak the frame vital part for the pilot’s life. Similar experiments had been performed [10, 11]; Reference [10] shows blunt nose shape generate much stronger bow-shock near the nose and larger drag as shown in Fig. 2.21. Totally, blunt shape and sharp nose is differentiated near 50% while difference between blunt nose are relatively small.
For the nose shape of the missile, seeker should be placed to search and guide purpose, and various types of the nose shapes were tested as shown in Fig. 2.22 [11]. Sharp window shape, blunt nose with aerospike, and meshed sharp nose were introduced. As shown in Fig. 2.23, drag of sharp nose shape is definitely small while window type effectively reduces the shock increase near M1.0. Meshed type and aerospike also reduce the drag however, effect of them is not significant as that of sharp or window-nose.
More complex shape of wing-body combination was measured in free-flight test [12], and sophisticated breakdown of drag components was attempted.

Fig. 2.20. Drag measurement of canopy part using experimental rocket vehicle [9]

Fig. 2.21. Drag measurement of various nose shapes using experimental rocket vehicle [10]

Fig. 2.22. Drag measurement of various nose shapes using experimental rocket vehicle [11]

Fig. 2.23. Drag measurement of various nose shapes using experimental rocket vehicle [11]

Fig. 2.24. Drag measurement of wing-body combination [12]
Rather than expensive and un-expected flight test, wind-tunnel test is much attractive option and numerous studies were performed. Only just part of them are introduced. In most cases, wind-tunnel test for minimum drag should be performed with consideration of the propulsion effect as shown in Fig. 2.25[3]. Existence of stream for inlet should be well understood for during the wind-tunnel test. Variance of mass-flow for the inlet is tested for the flight condition speeds because it simulates throttle status in various Mach number.
Before, we discuss effect of propulsion on the minimum drag in wind-tunnel test, we should consider more basic experiments first. Egger et al. [13] tested both minimum drag value predicted by linear theory and wind-tunnel experiment at high supersonic speed; minimum drag shape could be differentiated by what theory is used as shown in Fig. 2.26. Stoney Jr [14] measure the effect of afterbody shape on drag; result shows larger base area induces much higher drag than other shape for long body as shown in Fig. 2.27. However, for short body, tendency is sometimes reversed because stream cannot be attached on the body for sudden change of afterbody.
As an evaluation of drag for ammunition, Ulman and Dunning [15] and Stoney and Royall [16] tested various shape of missiles or bomb for their zero-lift drag. In most case, longer body generates more skin-friction drag in subsonic region while short body induces higher drag in wave drag perspective.

Fig. 2.25. Drag measurement technique considering propulsion effect [3]

Fig. 2.26. Drag comparison between impact theory and linear theory [13]

Fig. 2.27. Drag comparison among afterbody-shape [14]

Fig. 2.28. Drag comparison among several ballistic-type missiles [15]
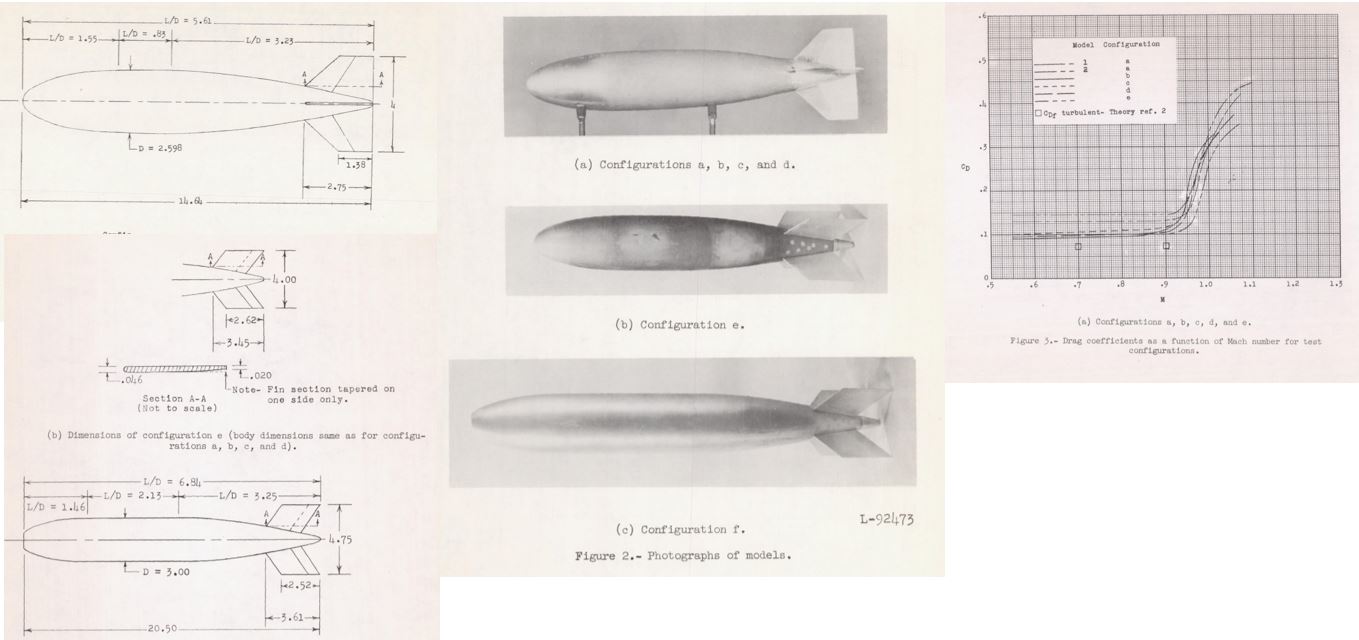
Fig. 2.29. Zero-lift drag evaluation for various bomb shape in high-subsonic and transonic region [16]
Other than evaluation of simple shape, minimum drag or zero-lift drag of complex ones have conducted for wing-body combination which even includes large fuselage cavity and partially submerged store [17]. Recent fighter-bomber style aircraft rarely uses that kind of payload store however, early single-purpose nuclear bombers like Vulcan, Mirage IV, or Russian Tu-22’s Kh-22 missiles. As shown in the Fig. 2.30, streamlined payload generate much less drag than the conventional pylon, then designer of bombers or interdiction aircraft preferred.
Deep parametric study for wing-body combination was conducted by Whitcomb [18] using various types of wing described in Fig. 2.31. Strict comparison was done for wing-drag because additional volume change via wing is independently examined. Most of the drag change in combination is caused by volume change while wing induced one is about half of the volume one. If highly swept wing is applied to the body, the wing induced drag rise become much smaller than that of straight wing. Continued study in Fig. 2.32 shows drag-rise is how much sensitive to wing-body; wing should be attached at the after position of peak thickness of body. Also highly swept wing generate less drag-rise than straight and delta wing however, pure swept wing is prone to high AoA problem and structural issues.
Howell and Braslow [19] added inlet effect on the wind-tunnel experiment; importance of this experiment is evaluation of drag-rise change via Reynolds number effect. Higher Reynolds number condition shows less drag rise value than the smaller one, wind-tunnel experiment. However, still, free-flight test record less drag rise than the experiment even at the same Reynolds number condition. Sensitive transition effect of real-flight test might affect the result difference.
Fig. 2.34 [20] shows effect of thickness variation of wing for supersonic drag, and result tells concentrated structures shows less drag at high supersonic while early drag rise in transonic region. Distributed structures has less profile thickness at transonic region however, it has certain critical Mach number where tendency is reversed. Practically, thickness of the wing-tip is determined by structural thickness, and this result help to how to determine the thickness of the wing-root for optimized drag profile.
Henderson Jr [21] investigated the zero-lift drag of the several delta-wing model with thickness and swept angle variations as shown in Fig. 2.35. The result in Fig. 2.36 shows uniform thickness reduction rate for span-wise direction has less L/D performance than concentrated configuration. It is universal for various swept angle while smaller swept angle has larger L/D and CL for certain AoA.

Fig. 2.30. Drag distribution of submerged payload [17]

Fig. 2.31. Drag rise of transonic region via wing-body combination configuration; independently investigated for wing-volume and wing-shape [18]

Fig. 2.32. Drag rise of transonic region via wing-body combination configuration; independently investigated for wing-volume and wing-shape. CONTINUED [18]

Fig. 2.33. Drag rise of transonic region via wing-body combination configuration with inlet [19]

Fig. 2.34. Zero-lift drag change at supersonic condition with wings having various thickness ratio and chord [20]

Fig. 2.35. Zero-lift drag measurement model of delta wings [21]

Fig. 2.36. Zero-lift drag measurement result of the models [21]
Marlet [22] tested two types of inlet on the delta-wing jet configuration; drag change, amount of mass flow for inlet, and breakdown of drag components are conducted. Risen peak of drag is higher for the conventional cone model because it has smaller captured area. Smaller captured area means larger spillage component. Interesting point of the result is that although the conventional cone model capture more area at high supersonic Mach number, drag of the conventional one is higher than that of streamlined inlet as shown in Fig. 2.37-38.
For this result, streamlined one seems to be superior than the cone however, in real world, usage of the cone is overwhelmingly common than streamlined one. One of the reason is that the cone type inlet is easy to change the position of the shock for the inlet performance while streamlined one is almost fixed for the one position.
More sophisticated application of the experiment is evaluation of the prop-fan [23]; possibility of drag reduction caused by prop-fan installation on subsonic transport. The Experiment evaluated various types of install configuration; fillet and strake increase drag for more than M0.75 and vice versa. Shape of the airfoil is modified to optimize pressure distribution along chord direction; thickness of leading edge part is little bit reduced in Fig. 2.39-40.
Early attempt for evaluation of the propulsion effect and afterbody on drag was performed by Maraes and Nowitzky [24] as shown in Fig. 2.41. Better summary of the technique related to the engine nacelle was performed by Kulfan [25]; it proposed glance approach, pressure approximation from adjacent nacelle, is better than wrap one using far-field approach. Nacelle installed drag consists of friction, wave and lift interference drag, and optimized configuration of the propulsion is important for drag/lift characteristics of the whole aircraft as shown in Fig. 2.42. Three types of the four-engine installation configurations are compared as shown in Fig. 2.43; following results are provided in Fig. 2.44-45. Result showed that pressure and shock structure change via nacelle position. Interference drag is maximized at 0.5 chord installation while experiment result represents smaller discrepancy than that of the theory. For the drag, installation of nacelle on after 0.5 chord has definite advantage than the front one.
Effect of sting for the wind-tunnel experiment is summarized by Mackay [25]; it summarized semi-empirical pressure and velocity correction equation for the sting effect in terms of geometric shape. He organized impact of sting on the experiment as overall, local disturbance, geometrical distortion; overall disturbance distort whole flow tendency around the model caused by blockage or interference; local disturbance means sting makes unwanted distortion of flow around the model; geometrical distortion makes unrealistic interface structure via sting for the aircraft model as shown in Fig. 2.46.

Fig. 2.37. Wind-tunnel model for the inlet type comparison [22]

Fig. 2.38. Zero-lift drag measurement result for the two types of inlet [22]

Fig. 2.39. Drag measurement result for Prop-fan installation effect [23]

Fig. 2.40. Drag measurement result for Prop-fan installation effect. CONTINUED [23]

Fig. 2.41. Drag measurement result for afterbody shape of propulsion nozzle [24]

Fig. 2.42. Drag evaluation technique comparison for supersonic transport configuration [25]

Fig. 2.43. Drag evaluation technique comparison for supersonic transport configuration. CONTINUED [25]

Fig. 2.44. Drag evaluation technique comparison for supersonic transport configuration. CONTINUED [25]

Fig. 2.45. Drag evaluation technique comparison for supersonic transport configuration. CONTINUED [25]

Fig. 2.46. Effect of sting on the wind-tunnel experiment result [26]
Design of inlet and its experiment is well summarized by Chima [27]; design condition and phenomenon like buzz and hammer shock is well described. Buzz is the phenomenon that inlet flow is vibrated condition via change of mass flow usually caused by flow separation in the duct. It is very dangerous for the engine for not only performance also structural and combustion safety. Unwanted vibration hugely changed the mass flow and position of the shock is also vibrated. In that paper, CFD result and wind-tunnel experiment results are well compared; upwind scheme is not preferred to predict the flow of the duct.

Fig. 2.47. Wind-tunnel experiment and CFD result for inlet problem and design [27]

Fig. 2.48. Wind-tunnel experiment and CFD result for inlet problem and design. COTINUED [27]

Fig. 2.49. Wind-tunnel experiment and CFD result for inlet problem and design. COTINUED [27]

Fig. 2.50. Wind-tunnel experiment and CFD result for inlet problem and design. COTINUED [27]
* Reference
[1] Hoerner, S. F., 1965, Fluid-Dynamic Drag: Theoretical, Experimental, and Statistical Information
[2] Mason, W. H., 2006, ConfigAeroDrag
[3] Jobe, C. E., 1984, Prediction of Aerodynamic Drag, AFWAL-TM-84-203
[4] Marino, A ., et al., 1975, Evaluation of Viscous Drag Reduction Schemes for Subsonic Transport, NASA CR-132718
[5] Sawyer, R. H., and Trant, Jr. J. P., 1950, Effect of Various Modifications on Drag and Longitudinal Stability and Control Characteristics at Tansonic Speeds of a Model of the XF7U-1 Tailess Airplanes, NACA RM SL50D18
[6] Edwards, J. B. W., 1964, Free-Flight Measurements of the Zero-Lift Drag of a Slender Ogee Wing at Transonic and Supersonic Speeds, Ministry of Aviation, Aeronautical Research Council
[7] Katz, E., 1949, Flight Investigation from high subsonic to supersonic speeds to determine the zero-lift drag of a transonic research vehicle having wings of 45 deg sweepback, aspect ratio 4, taper ratio 0.6, and NACA65A006 airfoil sections, NACA RM L9H30
[8] Leiss, A., 1952, Flight Measurement at Mach Numbers from 1.1 to 1.9 of the Zero-Lift Drag of a Twin-Engine Supersonic Ram-Jet Configuration, NACA RM L52D24
[9] Hoffman, S., and Chaubin, L. T., 1961, Aerodynamic Heat Transfer and Zero-Lift Drag of a Flat Windshield Canopy on the NACA RM-10 Research Vehicle at High Reynolds Numbers for a Flight Mach Number Range from 1.5 to 3.0, NACA RM L56G05
[10] Piland, R. O., and Putland, L. W., 1957, Zero-Lift Drag of Several Conical and Blunt Nose Shapes Obtained in Free Flight at Mach Numbers of 0.7 to 1.3, NACA RM L54A27
[11] Piland, R. O., 1957, Preliminary Free-Flight Investigation of the Zero-Lift Drag Penalties of Several Missile Nose Shapes for Infrared Seeking Devices, NACA RM L52F23
[12] Edwards, J. B. W., 1964, Free-Flight Measurements of the Zero-Lift Drag of a Slender Ogee Wing at Transonic and Supersonic Speeds, Ministry of Aviation, Aeronautical Research Council
[13] Egger, A. J., et al., 1956, Bodies of Revolution having Minimum Drag at High Supersonic Airspeeds, NACA TN 3666
[14] Stoney Jr, W. E., 1953, Some Experimental Effects of Afterbody Shape on the Zero-Lift Drarg of Bodies for Mach Numbers between 0.8 and 1.3, NACA RM L53I01
[15] Ulman, E. F., and Dunning, R. W., 1954, Normal Force, Center of Pressure, and Zero-Lift Drag of Several Ballistic-Type Missiles at Mach Number 4.05, NACA RM L54D30a
[16] Stoney, W. E., and Royall, J. F., 1956, Zero-Lift Drag of a Series of Bomb Shapes at Mach Numbers from 0.6 to 1.1, NACA RM L56D16
[17] Hoffman, S., 1959, Zero-Lift Drag of a Large Fuselage Cavity and a Partially Submerged Store on a 52.5 deg Sweptback-Wing-Body Configuration as Determined from Free-Flight Tests at Mach Numbers of 0.7 to 1.53, NACA RM L56L21
[18] Whitcomb, R. T., 1956, A Study of the Zero-Lift Drag-Rise Characteristics of Wing-Body Combinations near the Speed of Sound, NACA Report 1273
[19] Howell, R. R., and Braslow, A. L., 1957, Experimental Study of the Effects of Scale on the Absolute Values of Zero-Lift Drag of Aircraft Configurations at Transonic Speeds, NACA RM L56J29
[20] Shrout, B. L., 1965, Zero-Lift Drag at Mach 1.42, 1.83, and 2.21 of a series of wings with variations of thickness ratio and chord, NASA TN D-2811
[21] Henderson Jr. A., 1955, Experimental Investigation of the Zero-Lift Wave Drag of Seven Pairs of Delta Wings with Constant and Varying Thickness Ratios at Mach Numbers of 1.62, 1.93, and 2.41, NACA RM L55D13
[22] Merlet, C. F., 1955, The Effect of Inlet Installation on the Zero-Lift Drag of a 60 deg Delta-Wing-Body Configuration from Flight Tests at Mach Numbers from 0.8 to 1.88, NACA RM L55I09
[23] Smith, R. C., et al., 1987, Summary of Studies to Reduce Wing-Mounted Profan Installation Drag on an M = 0.8 Transport, NASA Technical paper 2678
[24] Moraes, C. A., and Nowitzky, A. M., 1954, Experimental Effects of Propulsive Jets and Afterbody Configurations on the Zero-Lift Drag of Bodies of Revolution at a Mach Number of 1.59, NACA RM L54C16
[25] Kulfan, R. M., 1979, Prediction of Nacelle Aerodynamic Interference Effects at Low Supersonic Mach Numbers, NASA CP-2108
[26] Mackay, M., 1993, A Review of Sting Support interference and Some Related Issues for the Marine Dynamic Test Facility, AD-A271 806
[27] Chima, R. V., 2012, Analysis of Buzz in a Supersonic Inlet, NASA/TM-2012-217612
[28] Page, W. A., 1957, Influence of the Body Flow Field on the Zero-Lift Wave Drag of Wing-Body Combinations Modified in Accordance with the Transonic Area Rule, NACA RM A55K10
[29] Fuller, F. B., and Briggs, B. R., 1951, Minimum Wave Drag of Bodies of Revolution with a Cylindrical Section, NACA TN 2325
[30] Holdaway, G. H., and Mersman, W. A., 1956, Application of Tchebichef Form of Harmonic Analysis to the Calculation of Zero-Lift Wave Drag, NACA RM A55J28
[31] Lomax, H., 1955, The Wave Drag of Arbitrary Configurations in Linearized Flow as Determined By Areas and Forces in Oblique Planes, NACA RM A55A18
[32] Miele, A., 1966, Similarity Laws for Lifting Wings of Minimum Drag at Hypersonic Speed, NASA CR70729
[33] Adams, M. C., 1951, Determination of Shapes of Boattail Bodies of Revolution for Minimum Wave Drag
[34] Llorca, I. B., 2015, CFD Analysis and Assessment of the Stability and Control of a Supersonic Business Jet, KTH
[35] Kulfan, B., 2009, New Supersonic Wing Far-Field Compsite Element Wave-Drag Optimization Method, J. Aircraft
[36] Cartieri, A., and Boyet, M. G., 2010, Study of Support Interference Effects at S1MA Wind Tunnel within the “SAO” Project, ICAS 2010
[37] Willhite, P., et al., 1995, A Critical Evaluation of CFD Predictions of Full Aircraft Drag Increments, 26th AIAA Fluid Dynamics Conference, AIAA 95-2289
[38] Slater, J. W., 2012, Design and Analysis Tool for External-Compression Supersonic Inlets, NASA/TM-2012-217660
[39] Keye, S., and Gammon, M. R., 2017, Development of Deformed Computer-Aided Design Geometries for the Sixth Drag Prediction Workshop, J. Aircraft
[40] Gregg, R., 2014, CFD and Aircraft Design, Boeing
댓글 없음:
댓글 쓰기