Table of Contents

Aerodynamics Series

2019년 7월 23일 화요일

W.I.P status of Missile-SIM : Addition of 3D Coordinate

Previous Work Status

Initial Version of Missile-SIM for Performance evaluation
Aerodynamic Validation of Missile-SIM for Trajectory 
AIM-120C Study using Missile-SIM : Part 1 - Sensitivity
AIM-120C Study using Missile-SIM : Part 2 - Launch Condition
AIM-120C Study using Missile-SIM : Part 2 - Launch Condition - revision
Patch note of Missile-SIM : Guidance Algorithm is added w/ Real-Time plot
W.I.P status of Missile-SIM : Addition of Air-propulsion part 1
W.I.P status of Missile-SIM : Addition of Air-propulsion part 2
AIM-120C Study using Missile-SIM : Part 3 - CUDA / LREW / METEOR types. 1 : Baseline Comparison
AIM-120C Study using Missile-SIM : Part 3 - CUDA / LREW / METEOR types. 2 : Sensitivity Analysis
AIM-120C Study using Missile-SIM : Part 3 - CUDA / LREW / METEOR types. 3 : Few mentions


 7. Addition of 3D Coordinate

 After I conducted analysis of Air-to-Air missile series, I should add longer range missiles for my analysis which requires coordinate of surface of the earth. Conventional coordinate of the Missile-SIM is basically two dimension with 2DOF limited due to the CFD resource. 

 DOF is not expanded which requires several additional coefficient and inertia values. Effect of Coriolis is considered and it could give more precise trajectory simulation for the Missile-SIM. 

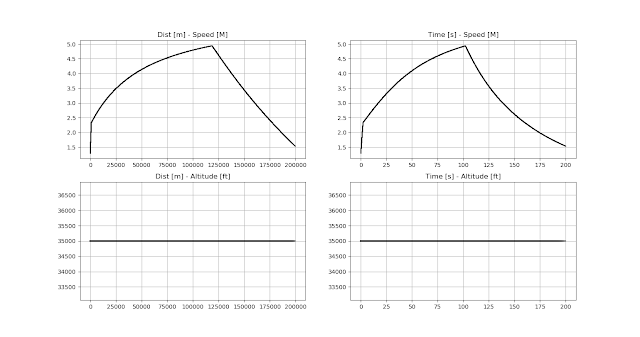
 Below is sample result using generic Meteor type missile. (shoot the missile 60deg from North)

 Resulted range is about 200 km from Seoul. 


MiG-21 Display at 2019


2019년 7월 9일 화요일

3. Summary CFD Workshop : 3.1.2 Part. 2 + 3.1.3


3. Summary of CFD Workshop

3.1.2. Result Comparison

 4) Summary of 4th Workshop

 Vassberg et al. [9] updated model for the new workshop; addition of tail as full integration of the aircraft is noticeable in Fig. 21. Details for the overset grid of the model is shown in Fig. 22 by Sclafani [10]; overset grid is basically buid-up of the sub-set grid of each part. The figure shows well how they sized the near-wall region and the tip. Specifically, grid-organization of the wing-tip cap is important for both main and tail-wing. Indeed, smaller size of the cap region is well extended to keep the growth of the cells. Numerical parameters related those grids are also shown. The result shown in Fig. 23 revealed more grid bring converged tendency for pressure drag rather than skin-friction one; value of the skin-friction drag is almost constant for huge grid change. Among the coefficient, pitching moment is relatively hard to converge for grid cost. Fig. 24 shows patch grid effect for the CFD solver which brought significant difference in wing-root rather than mid-span and the tip. 

 More than that, Rider [11] and Pirzadeh [12] report more details about the used grid. Rider shows detailed figures of structured grid in Fig. 25; concentrated lines are shown for edge of the wing-tip and nose inevitable for the structured one. Fig. 26 shows unstructured grid for the Cessna and NASA which shows growth of the grid near the edge of the wings. Oswald’s report [13] represents set up and grid of the ANSYS FLUENT, most widely used commercial CFD code for non-in-house users. He also reported error caused by discretization for prediction of the shock position. 


Fig. 21. CRM model for the 4th workshop and its OVERFLOW result


Fig. 22. Overset mesh detail for the CRM model; summary of the grid parameters are shown


Fig. 23. Grid convergence of overset mesh result


Fig. 24. CFD result difference caused by patch-grid


Fig. 25. Grid generated for structured multi-block wing-body


Fig. 26. Grid generated unstructured case


Fig. 27. CFD set up and grid for ANSYS FLUENT


Fig. 28. Details of error caused by discretization is shown for shock prediction


 Tinoco, et al [14] summarized grid convergence case 1 in Fig. 29; structured grid shows much better convergence than unstructured one. Most of the structured grid is robust for grid size change, and their results are in about width of 10 counts. More organized convergence graphs are shown in Fig. 30; most of the diverged term is coming from pressure drag while variance of the pitching moment is similar for both structured and un-structured grids. Down-wash un-wanted downstream caused by main-wing for tail-plane was studied as case 1b in Fig. 31; change of tail-incidence angle was also conducted. Generally, structural grid tends better convergence for several cases while prediction of the pitching moment in given lift coefficient is not easy. Continued Fig. 32 tells still there is a divergence among the participant’s data. Because now we had calculated the whole aircraft configuration with tails, authors made trimmed data compensated for pitching moment via horizontal tail deflection as shown in Fig. 33. 

 Case 2 shows drag rise via Mach number change of flight condition; SST model provided less drag than the SA model. While some case shows bizarre curve near the critical Mach number, overall tendency is almost similar for whole participants as shown in Fig. 34. Interestingly, as drag is increased by Mach number increase, difference between the cases became smaller. It is probably that contribution of the increased wave drag is not big-different for cases. However, before the rise, near minimum drag region combination of the skin-friction, pressure, and wave-drag made problem complex and generate relatively large difference among the CFD data. Case 3 provided change via Reynolds number effect; in given flight condition, M0.85 w/ CL=0.5, effect of the grid type and turbulence model is shown in Fig. 35. The data shows that increment of the Reynolds number did not make significant impact on the data because aircraft already enter the high Reynolds region. Indeed, difference caused by grid and turbulence model is also not significant. 


Fig. 29. Total drag convergence for several cases


Fig. 30. Drag convergence divided to pressure and skin-friction for several cases and pitching moment


Fig. 31. CFD cases of Downwash study including deflection effect of horizontal tail


Fig. 32. CFD cases of Downwash study including deflection effect of horizontal tail. Continued


Fig. 33. CFD cases of Downwash study for trimmed data


Fig. 34. CFD cases for drag rise curve as Mach number sweep


Fig. 35. CFD cases for Reynolds number effect


5) Summary of 5th Workshop

 As 4th PDW completed whole configuration of the airliner, now there is no need to add components for the model geometry. The 5th DPW [15] concentrated on higher level of grid convergence study, wing-body buffet and turbulence model verification for simple geometries. The buffet phenomena are described in my past articles, high AoA aerodynamics; separated airflow at the certain AoA make uncomfortable or asymmetric aerodynamic characteristics around the aircraft. It is also caused by shock-wave induced separation and boundary of the flow related to the buffet is shown in Fig. 36 [15]. 

 In the jet fighter aircraft, buffet could severely degrade the handling quality of the jet while it leads stall in some high AoA region. However, most buffet phenomenon in airliners is related to cruise flight condition in high altitude requiring medium lift coefficient; for CFD users, prediction of the flow separation caused by any reason is very challenging task. 

 Basic grid convergence study is shown in Fig. 37 and 38; Fig. 37 shows now extrapolation results are in about 5 counts band. And it is very positive trends of CFD development and calculation capability. As shown in Fig. 38, increase of number of grids leads to converged value of the total drag as the certain decrease trends; difference caused by the grid type is not significant compared to the size of them. In turbulence model, most of the models are in similar ranges. Fig. 39 shows more specific values of the result; most of the variation caused by the grid size is significant in pressure drag while skin-friction shows only small change via size. Interestingly, value of the skin-friction itself is slightly increased by grid-increase while the pressure one is decreased; total term is slightly decreased. 

 Result of pressure distribution along chord and span-wise direction is shown Fig. 40; difference occurs at near-wing-tip section. The section 12 shows discrimination between CFD and WT at the position of shock where cause of the shock became very complex via cross and wing-tip flow. The section 14 suction peak of the pressure distribution from the experiment is very different from the CFD. The result of the two point is interesting because the position and possible cause of the difference did not seem same. The flow around the suction peak is affected by both aero-elastic affect, downstream from the root section, and wing-tip vortex. Indeed, Pseudo data is artificially generated to fit the WT to CFD; aero-elastic effect is considered as shown in Fig. 41. Through the process, variance among the CFD result is almost similar to that of WT finally. 


Fig. 36. Coffin Corner; relation among speed, altitude and buffet [16]


Fig. 37. Variance of extrapolated drag value in CFD


Fig. 38. Drag prediction value change via grid size and their breakdown


Fig. 39. Sub-term of the drag via grid size


Fig. 40. Cp distribution result


Fig. 41. Pseudo WT result for consideration of aero-elastic effect of wing


6) Summary of 6th Workshop

 6th Workshop deeply studied more verifications of aero-elastic effect and newly introduced grid adaption effect, and coupled aero-structural simulation. Case 1 provided turbulence model verification because previous results converged difference value in the same turbulence model. As shown in Fig. 42 and 43 [17], there is a difference caused by solver and mesh generators. Except few cases with rough grids, all data seems to go converged point, however, still there are about 0.04 variance of CL and 0.002 of CD. This variance even in slow speed with simple airfoil is not negligible. More specific characterization of this divergence is analyzed in Fig. 43; there is no clear conclusion about the turbulence model while Cartesian grid type is slowly converged or not, related to the grid type. In that case, probably, adaptation technique might be helpful. 

 Tinoco [18] summarized CRM cases including aero-elastic effect; only prototype-style correction is done in the previous one. The amount of aero-elastic twist deformation is measured in WT as shown in Fig. 44; consideration of the twist for CFD gave significant improvement of correlation especially for near wing-tip. Fig. 45 provided the ‘conventional’ drag result of the workshop; now most of the participants shows highly converged data except relatively new participants like custom Cartesian grid type and LBM, Lattice Boltzmann Method. Variation tendency for pressure and skin-friction drag are similar to that of the previous workshops with enhanced variance width; interesting part is now pitching moment is converged significantly. Detailed grid type comparison is shown in Fig. 46, and still overset and multi-block grids are better for variance and convergence tendency. 


Fig. 42. Convergence of participant data for NACA0012


Fig. 43. Convergence of participant data for NACA0012 (2)


Fig. 44. Aero-elastic twist effect consideration


Fig. 45. Drag convergence result of grid size; total, pressure, skin-friction drag and pitching moment


Fig. 46. Detailed comparison for grid types


 Fig. 47 shows Cp result, and Eta=0.846 position still shows un-determined result. Although result from Eta=0.95 is better correlation, the 0.846 position is worse than 0.95. In x/c = 0.1~0.5, around the aerodynamic center, Cp value of the WT shows discrepancy. Even with the finest grids, overall tendency is kept, and addition of the nacelle and pylon made no-significant impact on the accuracy of the CFD. Cp value of the nacelle itself is described in Fig. 48; most of the result showed good agreement with each other. Net effect of the added nacelle-pylon is shown; because Cp is almost similar for CFD and WT, overall tendencies are very similar. Fig. 49 revealed most of the CFD solution little bit exaggerate the lift in the given AoA; in given AoA or CL, CFD data generally show higher CL or lower pitching moment than the WT data. These tendencies are universal for whole type of the grids and turbulence model used. 

 Derlaga [19] reported statistical analysis result of the solutions; except few out-sided data, most of the solutions are well converged in the limit as shown in Fig. 50. Fig. 51 shows typical representation of the data using Box/Viloin plot. Laflin and Orderson’s report [20] had focused on the phenomenon repeatability of CFD related to the flow separations, around the side-of-body and trailing edge. The separations had repeatedly reported in CFD; variation on the details of the CFD is huge compared to other regions. Fig. 52 shows two separations spots and the bubble near the side-of-body. Fig. 53 shows grid-refined result for both wing-body and nacelle-pylon added configurations; increase of grid size did not make converged result for the position of the bubble. It is always hard topic for the aerodynamicists. AoA sweep test for the separation bubble is shown for the Fig. 54; very slight increase of AoA made significant diverged trends of the CFD result. Unfortunately, whether grid-type or turbulence model is, the position of the bubble is changed. 
Visualized trailing edge separation is shown in Fig. 55; cross flow term made flow reversal and generate separation which can be shown in swept wing. Fig. 56 well represent variation of CFD method. 


Fig. 47. Sectional Cp result varied by grid type and turbulence model


Fig. 48. Sectional lift and pitching moment result of nacelle-pylon and net-effect are shown


Fig. 49. Sectional lift and pitching moment result of nacelle-pylon and net-effect are shown


Fig. 50. Statistical analysis of CFD solutions


Fig. 51. Statistical analysis of CFD solutions (2)


Fig. 52. Flow separation bubble at the trailing edge


Fig. 53. CFD variation via grid type and turbulence model


Fig. 54. CFD variation via AoA sweep


Fig. 55. Trailing edge flow separation due to cross-flow of swept wing


Fig. 56. CFD result variation related to trailing edge flow separation


3.1.3. Conclusion

It is hard to tell in short paragraph for long-development story of drag-prediction-workshops. In overall, as workshop was progressed, effect of added components, grid-size-convergence, and grid type comparison were well conducted and developed. However, still, variation caused by the turbulence model and flow-separation phenomena are open to make rule-of-thumb. In this workshop, it is interesting to watch there is no idea related to winglet one of the important state-of-art design for the airliners. 


* Reference

[1] Redeker, G., 1994, A Selection of Experimental Test Case for the Validation of CFD Codes, AGARD-AR-303 Vol. II
[2] Wahls, R. A., 2001, AIAA Drag Prediction Workshop Wind-Tunnel Data, AIAA CFD Prediction Workshop
[3] Vassberg, J. C., 2001, Guidelines for Baseline Grids, AIAA CFD Drag Prediction Workshop, 19th Applied Aerodynamic Conference
[4] Levy, D. W., 2001, AIAA CFD Drag Prediction Workshop : Data Summary Comparison
[5] Broderson, O., et al., 2001, Drag Prediction of Engine-Airframe Interference Effects Using Unstructured Navier-Stokes Calculations, AIAA 2001-2414
[6] Laflin, K., 2003, 2nd AIAA CFD Drag Prediction Workshop Data Summary and Comparison
[7] Hemsch, M. J., 2003, Statistical Analysis of CFD Solutions
[8] Tinocco, E. N., 2006, DLR F6/FX2B Summary, 3rd CFD Drag Prediction Workshop
[9] Vassberg, J. C., et al., 2008, Development of a Common Research Model for Applied CFD Validation Studies, AIAA-2008-6919
[10] Sclafani, A. J., et al., 2010, Drag Prediction for the NASA CRM Wing-Body-Tail using CFL3D and Overflow on an Overset Mesh
[11] Rider B. J., 2010, Structured Grid Summary for the 4th Drag Prediction Workshop
[12] Pirzadeh, S., 2010, Baseline Unstructured Grids, AIAA DPW4
[13] Oswald, M., 2010, 4th AIAA CFD Drag Prediction Workshop
[14] Tinoco, E. N., et al., 2009, DPW-IV Summary of Participants Data
[15] Levy, D., et al., 2013, Summary of Data from the Fifth AIAA CFD Drag Prediction Workshop
[16] https://allaboutairplanes.wordpress.com/2012/03/03/the-coffin-corner/
[17] Roy, C., 2017, DPW 6 Summary of Participant Data – Case 1: Code Verification
[18] Tinoco, E. N., 2017, Summary of Data from the Sixth AIAA CFD Drag Prediction Workshop: CRM Cases 2to 5
[19] Derlaga, J., et al., 2017, Preliminary Statistical Analysis of CFD Solutions
[20] Laflin, K., and Orderson, O., 2017, Side-of-Body & Trailing Edge Separations
[21] Rumsey, C. L., et al., Summary of the First AIAA CFD High Lift Prediction Workshop
[22] Rumsey, C. L., HiLiftPW-2 Summary
[23] Rumsey, C. L.., et al., Overview and Summary of the Third AIAA High Lift Prediction Workshop
[24] Yokokawa, Y., et al., 3rd AIAA CFD High Lift Prediction Workshop
[25] Chawner, J. R., et al., 2018, Summary of the 1st AIAA Geometry and Mesh Generation Worshop (GMGW-1) and Future Plans